Related:
Requires: Trade Reports has no edition restriction. Trade Rules features mentioned here (category override, pool alerts) need the Regular edition or above.
New and lightly tested: every part of this page was built recently and has not yet been through a long live session. Tell us if a number looks wrong.
Trades > Trade Reports (new) (Alt+Z) lists your trades, groups them any way you like, and shows realised and unrealised P&L down to each leg and each fill. Used as a journal it also records, per trade, what you would otherwise write by hand after closing a trade: a category, tags, a free-text note, and the figures traders track: days in trade (DIT), days to expiration at entry (DTE), the risk the trade carried and P&L as a percentage of that risk. Nothing is requested from IB: it reads your executions and the prices SOAP2 already holds, and anything unknown shows n/a, never 0.
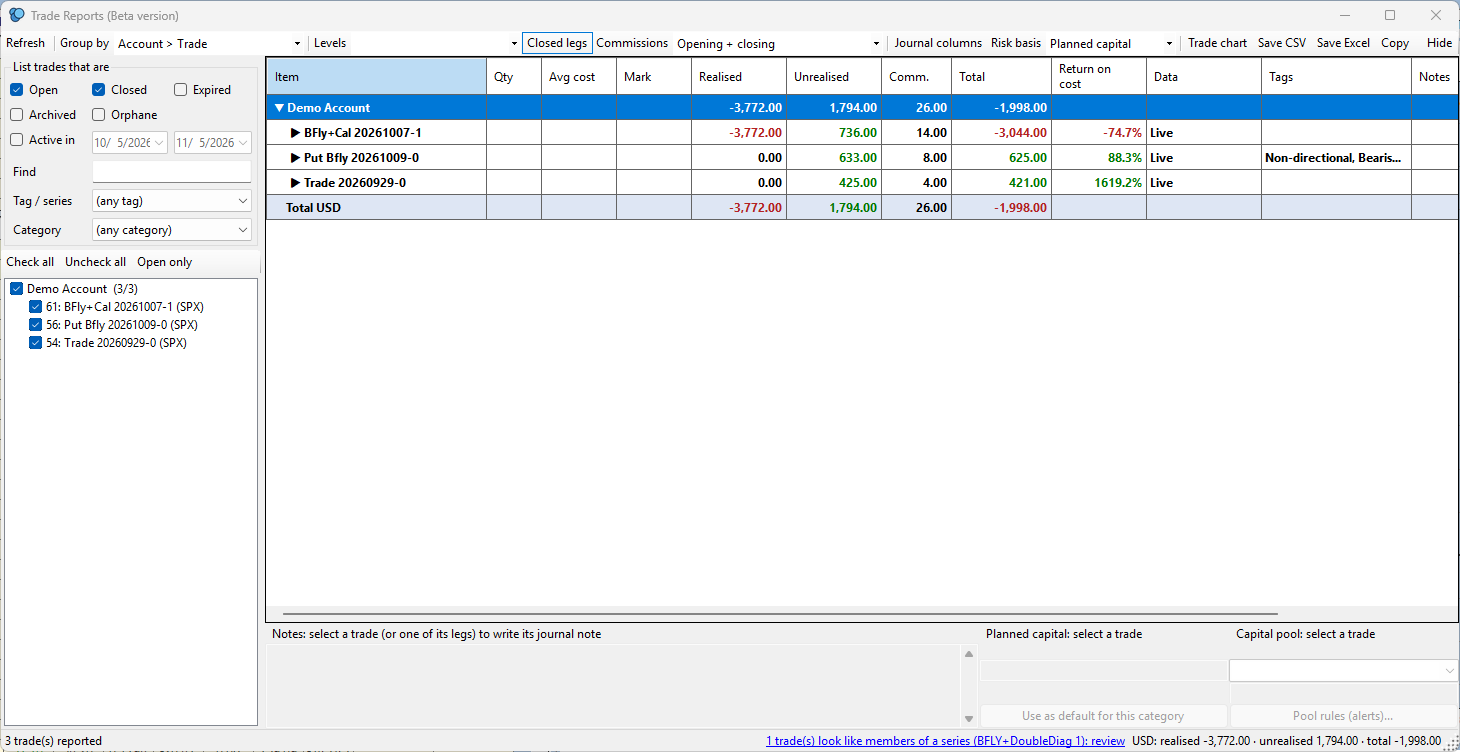
Reading the screenshot. The left panel filters the list (open, closed, expired, archived, tag, category, dates) and ticks the trades to report. The grid groups them by account and trade and shows quantity, average cost, realised, unrealised, commissions, total and return on cost; the Data column says whether the marks are live. The toolbar holds the Levels, Commissions, Risk basis and journal controls, and the bottom strip is for the trade's note, planned capital and capital pool.
Several columns look alike. Each answers one question:
| Column | What it tells you | Follows the Risk basis? |
|---|---|---|
| Realised, Unrealised, Commissions, Total | Your P&L in money | No |
| Return on cost | Total P&L divided by what the trade cost (the premium paid, or received) | No: never changes with the basis |
| Risk | The amount your P&L % is measured against | Yes |
| P&L % | Total P&L divided by the Risk amount: your return on risk, margin or planned capital | Yes |
| Capital used | The capital this row has in use | Yes |
| Basis | Which source the Risk amount came from, row by row | Yes |
Important: Risk, P&L %, Capital used and Basis are journal columns, and they are hidden until you press the Journal columns button (or choose the Journal grouping). If you cannot find a return on risk, that button is the reason. Return on cost is always visible.
Quick check, with made-up numbers: a trade has made +300. It cost 1,000 (return on cost 30.0%), carried a largest margin of 4,200 and has a planned capital of 10,000. With the Planned capital basis its P&L % is 3.0% (300 on 10,000); with Max margin it is 7.1% (300 on 4,200). The money did not change; only the yardstick did.
The Risk basis list chooses the yardstick. Pick the one you think in; the Basis column then shows, trade by trade, what was really used.
| Risk basis | What the Risk amount is | Shows n/a when |
|---|---|---|
| Planned capital (default) | The capital you earmarked for the trade (its own value, else its category's default). A trade with none falls back to its largest margin, then to its largest possible loss; its Basis cell then reads "(no plan)". | Nothing is known: a trade with unlimited risk and no margin, or no executions |
| Max margin | The largest margin the trade carried (see "What margin means here") | The trade has no executions |
| Current margin | The margin of what you hold now | A closed trade holds nothing |
| Max absolute risk | The largest loss the position could have shown at expiry at any moment of the trade (premium included). Adding to a position raises it; closing does not lower it | A trade that was ever unbounded (a naked short call) |
| Current risk | The same measure for what you hold now | A closed trade, or an unbounded one |
Mixed books are normal: some trades have a planned capital and some do not. With the default basis each trade uses its own figure, and the Basis column says which, for example "Planned capital", "Max margin (no plan)" or "Max loss (no plan)". Nothing is ever filled in with zero.
A quick look at another basis, without changing anything: hover a trade's P&L % cell. The tooltip gives the percentage on every basis, the chosen one in [brackets]. Hover the Risk cell to see which source was used and why.
"Margin" in Reports is SOAP2's own estimate, the same figure the Options Analysis window, Portfolio and the Trade Report use: the worst total P&L at expiry of the legs you hold, priced at your entry prices, plus what you have already realised. It is not the margin requirement your broker charges and can differ from it. Unlike Max absolute risk it gives a number for a naked short option.
The largest value is recorded while SOAP2 runs (about every 10 seconds it looks at trades whose executions are loaded and notes a new peak after an adjustment) and a later close never lowers it. A trade with no record is worked out from its executions when the report opens, so you get the same figure either way. If you correct a fill's price or fees, the figure is recomputed. Recording has not yet been checked on a live adjusted trade.
Pick Journal: trades by close date in the Group by list. You get one row per trade, newest close first (open trades last), with the journal columns on. The Journal columns button shows or hides the same columns in any other grouping. Click a column header to sort across all trades: Category, Opened, Closed, DIT, DTE, Risk, P&L %, Capital used.
Iron condor + Calendar. Short names work when they are unambiguous (Calendar finds "Calendar / diagonal"). The hybrid set is descriptive only: Trade Rules and templates use the primary category. Group by Category counts a trade once, under its primary. The Composition grouping lists a hybrid trade under each of its categories, so its group totals overlap; the total row still counts each trade once.Select a trade (or one of its legs): the box under the grid shows its note. Type, then click elsewhere to save; Esc undoes the edit since the last save. You can also double-click the Notes cell of a trade row. Notes, tags and categories are saved with the trade (they survive archiving) and are searched by the Find box and included in Save CSV, Save Excel and Copy.
Next to the notes box: type the capital you planned for the trade. It is the same value as the Planned Capital box of the Options Analysis window and the one Trade Rules use: change it in either place and the other shows it (Reports keeps no copy of its own). A trade that has none of its own uses the default of its category (and with the Planned capital basis, a trade with neither falls back to its largest margin, then its largest possible loss; the Basis column says so): type an amount and press Use as default for this category (clear the box and press it again to remove the default). A trade's own value is never changed by a default. The default lives with Trade Rules: the Options Analysis Planned Capital box shows it (greyed tooltip "default for ...") for a trade with no value of its own, the rules use it, and the rules editor hints it in its empty box.
A capital pool is a named pot of money, with an optional amount, that several trades draw on while you roll them. It is the way to watch the capital of a whole program (for instance a monthly Rhino entry) instead of trade by trade. You can use pools alone, trade by trade, or both.
The full story, with a worked example, is in two companion guides: SOAP2 Capital Pools Starter Guide (a monthly Rhino program from start to finish) and SOAP2 Categories Tags and Capital Pools (the complete reference, including what the Free edition includes).
To put many trades in a pool, or add or remove a tag on many, in one step: highlight the rows (Ctrl- or Shift-click; a group row stands for every trade below it), right-click, and choose Put selected trades in a capital pool..., Take selected trades out of their pool, Add a tag to selected trades... or Remove a tag from selected trades.... Only the highlighted rows are touched, and the status line reports the result.
One list on the toolbar chooses which fees count: Opening + closing, Opening only, Closing only, None, or Opening + closing + anticipated close. It starts from General Settings > Usage; your choice applies to this window. The anticipated close also deducts an estimate of what closing every open leg now would cost, from the account's fee schedule (Accounts panel). It is marked ~, kept apart from fees paid, and a leg whose rate is unknown makes the figure partial (*).
Ctrl- or Shift-click rows in the report: the status bar shows their total. A row inside a selected row (a leg of a selected trade) is not added twice, and amounts in different currencies are never added together.
ONE has no categories, so its users often keep one account per strategy and sort by account. In SOAP2 use Category, Tags and the Group by list instead: the real account stays the account. Many accounts still work, and Account and Account > Tag groupings are there if you want them.
Expand a leg to see its fills, then double-click the price of a fill (the Avg cost column), type the price you really got and press Enter. The fill row then shows the original in its Notes cell. Only the price changes (not the strike, quantity or contract). SOAP2 keeps the original in the execution's notes ([price was 5 until 2026-10-27]; a second correction keeps the first original), re-works the trade's P&L and updates an open Options Analysis window and Trade Log. You can make the same correction in the Trade Log's Price cell instead: whichever you save last prevails and the other follows. A leg that has a final settlement price cannot be corrected, and a Trade Log that holds unsaved edits of the trade is not overwritten (save or discard them there). To undo, double-click the price again and type the original, which the fill's note shows. (Back and Forward only simulate earlier states on the Trade Log ticks; they do not put an old price back in the trade file.)
| You see | Likely reason |
|---|---|
| No Risk, P&L %, Capital used or Basis column | They are journal columns: press Journal columns (or choose the Journal grouping) |
| Return on cost does not change when you change the Risk basis | Correct: it is measured on cost. P&L % is the column that follows the basis |
| P&L % reads n/a under Current risk or Current margin | The trade is closed: it holds nothing now |
| P&L % reads n/a under Max absolute risk | The trade was unbounded (a naked short call). Choose Planned capital or Max margin |
| Basis reads "Max margin (no plan)" or "Max loss (no plan)" | The trade has no planned capital and no category default, so the Planned capital basis fell back. Type a planned capital to use it |
| The two bases give the same percentage | The trade was never adjusted, so its current risk equals its largest risk |
| A margin figure differs from your broker's | Reports shows SOAP2's own RegT-at-expiry estimate, not the broker's requirement |
| You changed the default in General Settings and nothing moved | It applies the next time a report is built, and only while you have not picked a basis in this window's toolbar |