Market Statistics is the statistics window of the Feature Store (range, volatility, regime, cycle,
price levels and the plain-words outlook) without opening a Data Chart. The Data Chart keeps the
pictures; Market Statistics does the calculations for the index you have selected on the main form.
Requires: the Expert chart tools (currently also included in Premium). Available for
SPX, NDX and RUT only. New and lightly tested.
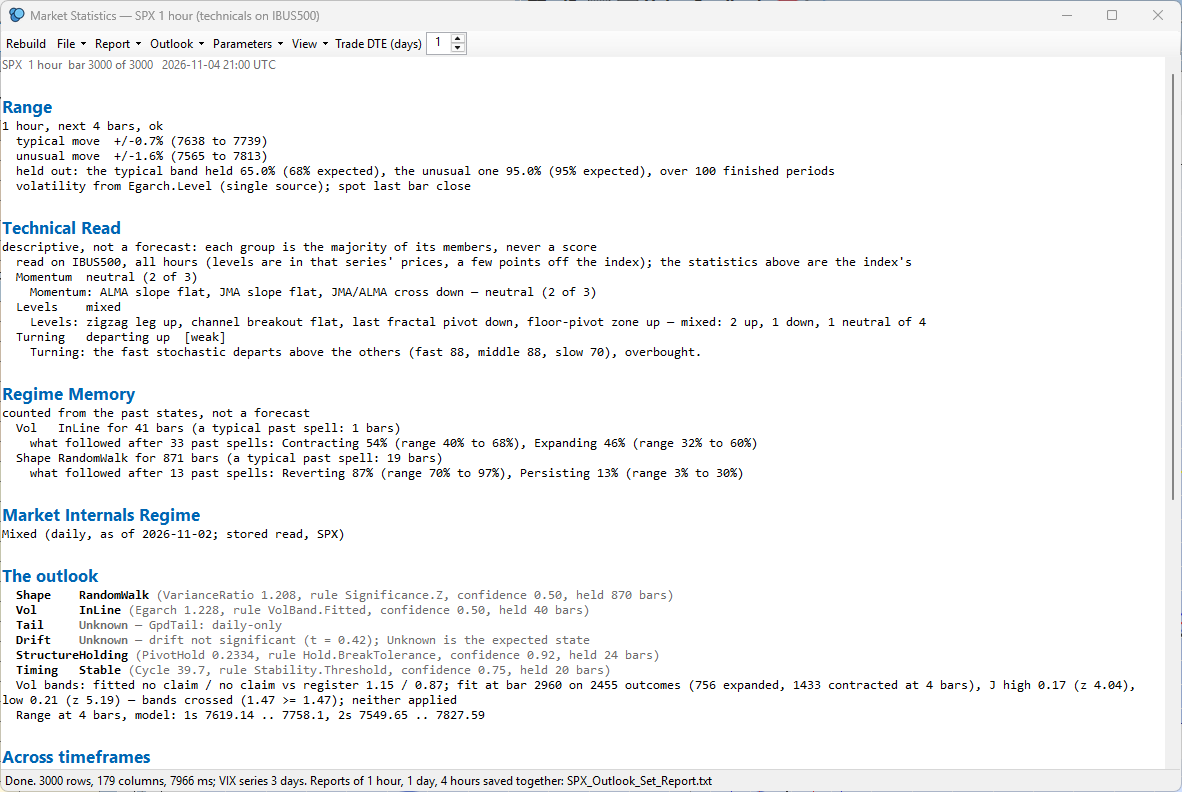
Reading the screenshot. The toolstrip has Rebuild, the File/Report/Outlook/Parameters/View menus and the Trade DTE box. The report reads top to bottom: Range (typical and unusual move for the next bars, with how often the bands held), Technical Read (momentum, levels and turning, each the majority of its members), Regime Memory (what followed past spells of the same state), then the outlook lines (Shape, Vol, Tail, Drift, Structure, Timing). Every block is descriptive, not a forecast, and the status line shows how many rows were read and where the report was saved.
On the main form, select SPX, NDX or RUT as the current symbol. For any other symbol the menu entry is greyed out and its tooltip says why.
Open the Data Chart menu and choose Market Statistics.
A small window asks three things:
Bar size: 1 hour, 4 hours or 1 day. The other bar sizes are built alongside it for the multi-frame section.
Read the technicals on IBUS500 / IBUST100 (all hours): see below. Ticked by default for SPX and NDX; greyed out for RUT, which has no known round-the-clock proxy.
Parameters...: the cycle range, trend persistence window, Murrey Math and JMA used by the statistics.
Press Open. The dashboard builds on its own and shows the report. Bars come from the saved history files first, then Tastytrade, then IB, so IB should be connected the first time.
The proxy when ticked (IBUS500 for SPX, IBUST100 for NDX); the index otherwise
The proxy is IB's CFD on the index. It trades round the clock, so it shows moves the index's regular-hours bars
hide, which gives a better technical read. The statistics (volatility, tails, range, regime) are defined on the
index's own returns and stay there.
Things to know when the proxy is used:
The TECHNICAL READ header says so: "read on IBUS500, all hours". Levels are in the proxy's prices, a few points off the index.
The cycle range is scaled to the proxy's bars per day. A range of 8 to 48 bars means a certain stretch of time on regular-hours hourly bars (6.5 a day); on 24-hour bars (24 a day) the same stretch is about 3.7 times more bars, so the range becomes about 30 to 177 for 1-hour bars and 24 to 144 for 4-hour bars. Daily bars are not changed. The trend persistence window is scaled the same way (30 becomes about 111 for 1-hour bars and 90 for 4-hour bars). Smoothing lengths (JMA, ALMA, stochastic) are used as they are.
If the proxy's bars cannot be fetched or are too few, that bar size falls back to the index's own technical read and the report says so.
The proxy's tools earn their admission on the proxy's own history, kept in separate files (IBUS500_*), never on the index's.
The first load of a proxy fetches about four years of hourly bars from IB, paced, so it is slow once. After that it only tops up.
The parameters
Parameters... edits the cycle range, abrupt-move gating, trend persistence window, Murrey Math
length and slow/fast, and the JMA length and phase. They start as your Data Chart's saved defaults
(the "Use Data Chart values" button copies them again) and are then saved on their own, in
Settings\FeatureStoreParameters.json.
The background Outlook (the 30-minute run behind Market Outlook and the AI assistant's
get_outlook) uses the same parameters and the same proxy tick. Market Statistics and the background run
write the same report files, so they must agree on both. Two consequences:
Changing a parameter or the proxy tick changes the background Outlook as well, from its next run.
Wherever your values differ from the built-in register (for example JMA length 7 against 9), the report headers and Market Outlook name it as "off the register". That is information, not an error.
The dashboard menus
The window's top row is a toolbar with dropdowns, so the common actions are one click away:
Rebuild: recompute everything. Trade DTE is the one box kept in view: the days to expiry of the trade you are considering.
File: Save CSV / Load CSV of the frame.
Report: the Detail level (Summary, Full, or the plain-words versions), Copy report, Report view and Market Outlook.
Outlook: Horizon, Vol bands, the expand margin, Multi-frame and the 1H/4H EGARCH switch.
Parameters: the Feature Store parameters (the same window as the launcher's) and the Thresholds.
View: show the Columns (advanced) list and the Chart (advanced) separately (either, both or neither), the z-score options, and Lock last bar. With the column list shown, a Columns submenu helps to choose what is plotted under the price: Show the evidence for... (one of the six answers of the report: Shape, Vol, Tail, Drift, Structure, Timing; its readings are ticked for you), Starter readings, Clear all ticks, and List labels and diagnostics too. Most users never need it: the report is the main view.
Where the results go
Reports and ledgers are saved under the index's name (for example SPX_1_hour_Report.txt in the
Features folder), the same files the background Outlook writes. The formatted report viewer ("Report view" on the
dashboard) and Market Outlook read them.
Limits and honest caveats
The technical read is descriptive, not a forecast.
The proxy and the index differ by a few points and can differ more outside the cash session; levels from the proxy are not the index's levels.
A proxy may reach back less far than the index. Tools that need a long history (EGARCH needs 500 bars or more) then read Unknown rather than a wrong number. The build status line gives the number of bars and the date they start.
The Data Chart's own Feature Store... button is unchanged and still works from the chart's live series and controls.